The Science of One-Hit Wonders!
See the one-hit wonder repo for the code and slides for this project!
The Question
For my last project, I explored the science behind one-hit wonders, or artists who only are only known for one song; think of songs like The Macarena, Come On Eileen, or, more recently, The Harlem Shake!
Since the beginning of Metis, I knew I wanted to do some sort of project with music and use the Spotify API, which provides numerical representations of the audio qualities of any song on Spotify (e.g. how danceable it is, the tempo, its loudness). As a pop music enthusiast, I was particularly interested in one-hit wonders because the phenomenon seemed pretty random! With the help of natural language processing and classification techniques, I wanted to see whether I could show if one-hit wonders weren’t a completely random phenomenon and figure out their ingredients.
For this project, I defined a one-hit wonder as an artist who only had one song reach the Billboard top 40. This definition comes from one-hit wonder expert and music journalist Wayne Jancik, the author of The Billboard Book of One-Hit Wonders, and seems to be the most common definition used in music literature. With this definition and a lovely dataset of the Billboard weekly Hot 100, I was off to the races!
Feature Engineering
After a lot of data cleaning, I did data manipulation to find songs that were eligible to be a one-hit wonder, or, in other words, an artist’s first song to reach the Billboard top 40. I then added in data via the Spotify API, including the genres of the artist (e.g. hip hop, pop) and the aforementioned audio features. I also added in the song’s lyrics, producers, and writers via the Genius API.
After performing some data validation, we had 1500 songs in our dataset, 48% of which were one-hit wonders, which I thought of as surprisingly high! Alas, it is better to have one hit wonder-ed than to never have one hit wonder-ed at all, right?
![]()
I really wanted to incorporate some of the natural language processing techniques I picked up at Metis, so I performed some feature engineering around the lyrics of songs. I used VADER to perform sentiment analysis, leveraged spaCy for named entity recognition (e.g. is the song using more specific language as opposed to more vague language or cliches), measured the reading difficulty of the lyrics using the Flesch Reading Ease, and quantified the variety of words in the lyrics through a custom metric.
I also wanted to compare the potential one-hit wonders to the music landscape at the time of the song’s release. To avoid data leakage, I compared each one hit wonder to the previous year’s top 100 songs via the Billboard year-end charts. These year-end charts are based off a song’s position and longevity on the weekly charts from the entire year. I used a dataset that already had the lyrics of the top songs. After adding in audio features and genres via Spotify’s API, I developed three metrics to measure how similar a song was to other music popular at the time!
-
Genre score, or genre popularity. This is defined as a count of how many songs’ artists from the year-end chart from the prior year had the same genre as the one-hit wonder’s artist (e.g. the potential one hit wonder was country and 15 songs on the prior year’s year-end charts were country, so the genre score is 15 points). I only looked at the genre with the highest score if the song’s artist had multiple genres.
-
Lyric distance, or how the lyrics of the song compare to the prior year’s top 100. I got a bit creative with this after clustering/DBScan wasn’t returning great results; I performed PCA on the TFIDF vectorizer of the songs from the prior year, then calculated the euclidean distance of the one-hit wonder’s from the center/average. The higher the lyric distance, the more unique a song’s lyrics are relative to other popular songs at the time.
-
Feature distance, or how the audio features compare to the prior year’s top 100. I used scaling and euclidean distance with the audio features to see if the production of the song was very different from the current music landspace.
Modeling
Now, it’s time for the most satisfying part of the data science process- modeling!
Throughout this process, I tried a bunch of classification models: logistic regression with lasso and/or ridge regularization, linear SVM, random forests, KNN, XGBoost, and a neural network with 2 hidden layers.
Optimizing the F-score, the neural network worked best (see scores from the test set below after I did some threshold tuning). All of the linear models also performed strongly. I then dove into finding out the ingredients of a one-hit wonder, or, in data science term, feature importance. For this, I used the logistic regression.
| Metric | Score |
|---|---|
| F-Score | 0.71 |
| Recall | 0.88 |
| Precision | 0.60 |
| AUC | 0.73 |
| Accuracy | 0.66 |
Results
And the moment you’ve all been waiting for: the ingredients of a one-hit wonder! Below are the most important and statistically significant features that increase the song’s probability of being a one-hit wonder!
-
Relatively poor performance on the Billboard weekly charts. This finding is quite intuitive; if a song’s peak position is closer to 40 than to 1 and the song wasn’t on the weekly charts for a long period of time, it’s more likely going to be a one-hit wonder.
- Let’s look at How You Remind Me by Nickelback! The song was on the weekly charts for 49 weeks and peaked at number one, decreasing the Nickelback’s chance of being a one-hit wonder.
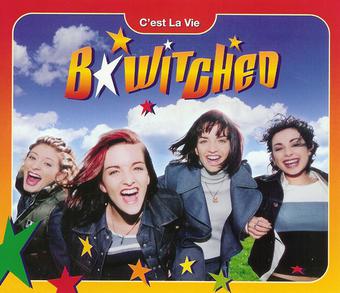
- On the other hand, let’s look at Irish girl group B Witched and their surprisingly racy first single C’est La Vie (I hadn’t heard the song since 1999- the things I can pick up on now!). The song peaked at number 9, but was only on the chart for 15 weeks; for a top ten song, this is a pretty short stay on the charts, so the song was more likely to be a one-hit wonder.
-
If an artist is featured on the song! I think this is also intuitive- if there’s a featured artist, it’s more difficult to say who drove the song’s success.
- As an example, think of American Boy by Estelle ft. Kanye West or Latch by Disclosure ft. Sam Smith!
-
If the lyrics are similar to other popular songs at the time. This was a surprising finding to me! When I think of one-hit wonders, I think of songs with odd lyrics (e.g. The Macarena, I’m Too Sexy, Barbie Girl, etc). These songs may be the exception, but in general, the more unorthodox the lyrics, the lower chance a song is going to be a one-hit wonder.
- An example of a song that had a low lyric distance score (aka it was similar to other songs released at the time) is What Is Love by Haddaway. If you look at the lyrics, you can see they’re a bit generic (but undeniably catchy).
-
If the genre of the artist isn’t popular at the song’s time of release.
- Let’s look at Ho Hey by The Lumineers. Released in 2012, The Lumineers are a folk/rock group. Only two songs’ artists in 2011’s year-end top 100 songs had these genres, increasing the song’s probability of being a one-hit wonder!
- If the song was released in the 2010s. My initial thought on this had to do with the shift in how we consume music over the past 20 years, from radio and CDs, to digital purchases, and, finally, to streaming. In addition, Billboard has been tweaking how they count streams in their rankings throughout the 2010s! My hypothesis is that all these changes have contributed to one-hit wonders being more likely in the 2010s, but I have to do a bit more research!
- Lastly, some genres were more likely to be one-hit wonders than others! Artists categorized as R&B a relatively higher chance of being a one-hit wonder, while Country and Hip Hop artists were the least likely to be one-hit wonders.
Farewell!
I hope you enjoyed my analysis, and the next time you ponder why that artist you loved from a few years ago hasn’t had much success lately, consider these findings! Finally, I’ll leave you with some of my favorite one-hit wonders ![]()